Quiz Reporting
The information below describes how you, the quiz creator, can use the IVQ feature to view analytics.
View Average Quiz Results
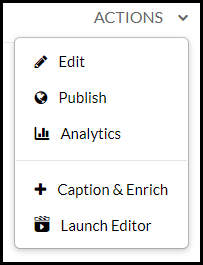
- Select Analytics from the Actions drop-down menu.
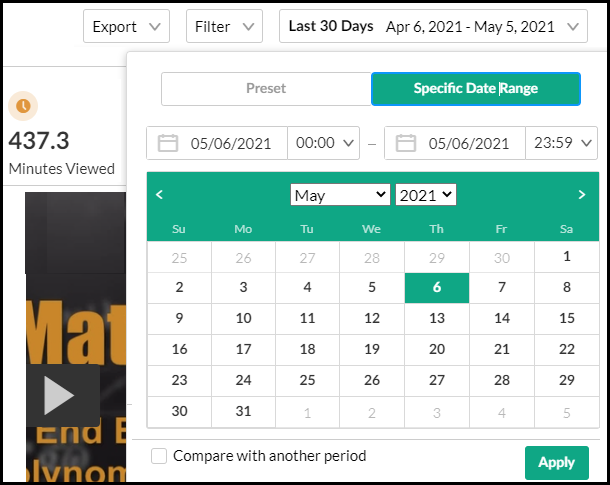
- In the General Metrics Average Score field, you can view the average score of all the users that have taken the quiz until now. Use the drop-down menu to set the time period for the analytics information.
View Quiz Results for a Specific User
- Click the Quiz Users tab. [B]
A report with all users is displayed with a breakdown of how each question was answered by each user.
All anonymous users (not logged in) that have taken the quiz, will be identified as a single anonymous user. - To export the data in this report, click Export and select CSV file or Printable Version. Alternatively, click on the Dashboard to view the report.

View Specific Questions and Answers
- Click the Quiz Questions tab [A]
A report with all questions is shown with a breakdown of how each user was answering it.
All anonymous users (not logged in) that have taken the quiz, will be identified as a single anonymous user. - To export the data in this report, click Export and select CSV file or Printable Version. Alternatively, click on the Dashboard to view the report.